

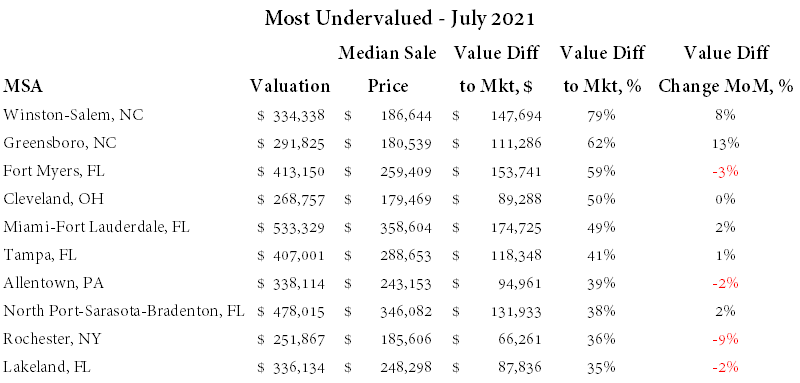
The ten most undervalued residential real estate markets for July 2021: Florida and North Carolina account for 50% of the top ten markets. These markets have current median sales prices that are 35% to 79% below our fair value estimates or UNDERVALUED.
Since last month, we have seen increases in the market valuation differentials in our two leading markets – Winstom-Salem, NC and Greensboro, NC. Compared to last month, Greensboro, NC had the largest increase in relative value differential across all markets (+13% points) which is attributed to higher rents, reduced unemployment and a slightly lower realized median sales price.
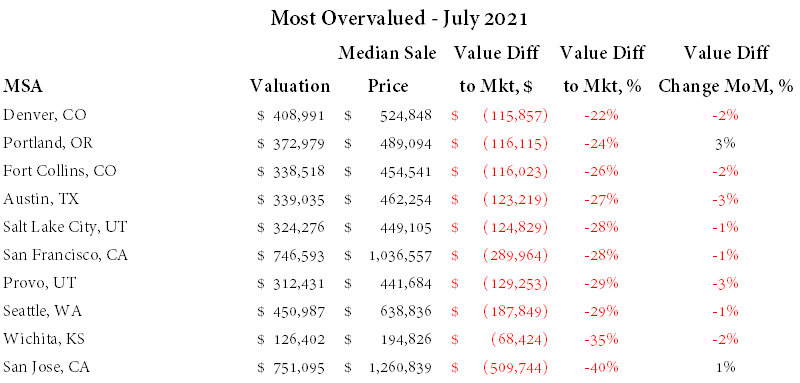
The ten most overvalued residential real estate markets are listed below. These markets have current median sales prices that are 22% to 40% above our fair value estimates or OVERVALUED.
Since last month, Denver joins the list, despite seeing an increased valuation estimate. Aside from this, we have not seen much relative change on the overvalued list. We have seen value differentials worsen but not by more than 3% points. San Jose and Wichita remain the two most overvalued markets in the US based on fundamentals.
The full updated MSA Valuation list for July 2021 is provided below:
| Rank | MSA | Valuation | Median Sale Price | Value Diff to Mkt, $ | Value Diff to Mkt, % | Value Diff Change MoM, % |
| 1 | Winston-Salem, NC | $ 334,338 | $ 186,644 | $ 147,694 | 79.1% | 7.5% |
| 2 | Greensboro, NC | $ 291,825 | $ 180,539 | $ 111,286 | 61.6% | 13.0% |
| 3 | Fort Myers, FL | $ 413,150 | $ 259,409 | $ 153,741 | 59.3% | -2.5% |
| 4 | Cleveland, OH | $ 268,757 | $ 179,469 | $ 89,288 | 49.8% | 0.5% |
| 5 | Miami-Fort Lauderdale, FL | $ 533,329 | $ 358,604 | $ 174,725 | 48.7% | 1.6% |
| 6 | Tampa, FL | $ 407,001 | $ 288,653 | $ 118,348 | 41.0% | 0.7% |
| 7 | Allentown, PA | $ 338,114 | $ 243,153 | $ 94,961 | 39.1% | -1.9% |
| 8 | North Port-Sarasota-Bradenton, FL | $ 478,015 | $ 346,082 | $ 131,933 | 38.1% | 1.9% |
| 9 | Rochester, NY | $ 251,867 | $ 185,606 | $ 66,261 | 35.7% | -8.6% |
| 10 | Lakeland, FL | $ 336,134 | $ 248,298 | $ 87,836 | 35.4% | -1.7% |
| 11 | Memphis, TN | $ 305,238 | $ 227,019 | $ 78,219 | 34.5% | 2.0% |
| 12 | Philadelphia, PA | $ 376,110 | $ 286,261 | $ 89,849 | 31.4% | 4.0% |
| 13 | Springfield, MA | $ 334,477 | $ 263,042 | $ 71,435 | 27.2% | -6.0% |
| 14 | Syracuse, NY | $ 216,045 | $ 170,332 | $ 45,713 | 26.8% | N/A |
| 15 | Toledo, OH | $ 184,353 | $ 147,401 | $ 36,952 | 25.1% | 2.9% |
| 16 | Chicago, IL | $ 352,153 | $ 283,926 | $ 68,227 | 24.0% | -7.6% |
| 17 | Knoxville, TN | $ 308,775 | $ 252,591 | $ 56,184 | 22.2% | -0.7% |
| 18 | Atlanta, GA | $ 387,732 | $ 318,510 | $ 69,222 | 21.7% | 0.6% |
| 19 | Jacksonville, FL | $ 359,274 | $ 296,776 | $ 62,498 | 21.1% | 9.1% |
| 20 | Daytona Beach, FL | $ 331,738 | $ 274,892 | $ 56,846 | 20.7% | -0.3% |
| 21 | Stockton, CA | $ 567,287 | $ 473,714 | $ 93,573 | 19.8% | 0.1% |
| 22 | Charlotte, NC | $ 387,907 | $ 324,485 | $ 63,422 | 19.5% | 5.4% |
| 23 | Orlando, FL | $ 364,377 | $ 307,241 | $ 57,136 | 18.6% | 4.4% |
| 24 | Riverside, CA | $ 565,265 | $ 481,436 | $ 83,829 | 17.4% | -2.4% |
| 25 | Albany, NY | $ 268,464 | $ 229,049 | $ 39,415 | 17.2% | -5.9% |
| 26 | Baltimore, MD | $ 376,229 | $ 322,694 | $ 53,535 | 16.6% | 3.4% |
| 27 | Cincinnati, OH | $ 260,104 | $ 224,771 | $ 35,333 | 15.7% | -12.2% |
| 28 | Indianapolis, IN | $ 275,244 | $ 239,692 | $ 35,552 | 14.8% | -5.7% |
| 29 | Dayton, OH | $ 193,010 | $ 169,060 | $ 23,950 | 14.2% | -0.7% |
| 30 | Detroit, MI | $ 259,477 | $ 229,674 | $ 29,803 | 13.0% | -11.0% |
| 31 | Pittsburgh, PA | $ 230,347 | $ 204,430 | $ 25,917 | 12.7% | -2.0% |
| 32 | Fresno, CA | $ 384,448 | $ 341,501 | $ 42,947 | 12.6% | 3.3% |
| 33 | Columbia, SC | $ 245,429 | $ 218,585 | $ 26,844 | 12.3% | N/A |
| 34 | Buffalo, NY | $ 220,959 | $ 198,042 | $ 22,917 | 11.6% | -6.6% |
| 35 | Jackson, MS | $ 250,441 | $ 225,754 | $ 24,687 | 10.9% | -0.7% |
| 36 | Baton Rouge, LA | $ 259,814 | $ 234,364 | $ 25,450 | 10.9% | 3.5% |
| 37 | New Haven, CT | $ 305,710 | $ 275,926 | $ 29,784 | 10.8% | 1.5% |
| 38 | El Paso, TX | $ 211,928 | $ 193,881 | $ 18,047 | 9.3% | -6.6% |
| 39 | Boston, MA | $ 611,697 | $ 564,606 | $ 47,091 | 8.3% | -9.0% |
| 40 | Hartford, CT | $ 290,110 | $ 269,163 | $ 20,947 | 7.8% | 2.5% |
| 41 | New York, NY | $ 545,101 | $ 508,297 | $ 36,804 | 7.2% | -6.9% |
| 42 | Providence, RI | $ 372,391 | $ 349,174 | $ 23,217 | 6.6% | -3.1% |
| 43 | Akron, OH | $ 178,614 | $ 167,721 | $ 10,893 | 6.5% | -2.4% |
| 44 | St. Louis, MO | $ 232,870 | $ 219,483 | $ 13,387 | 6.1% | -7.6% |
| 45 | New Orleans, LA | $ 258,177 | $ 243,862 | $ 14,315 | 5.9% | 3.7% |
| 46 | Birmingham, AL | $ 254,021 | $ 242,135 | $ 11,886 | 4.9% | -2.7% |
| 47 | Harrisburg, PA | $ 226,580 | $ 216,365 | $ 10,215 | 4.7% | -2.5% |
| 48 | Augusta, GA | $ 233,342 | $ 222,960 | $ 10,382 | 4.7% | -3.3% |
| 49 | Grand Rapids, MI | $ 269,827 | $ 258,415 | $ 11,412 | 4.4% | -1.7% |
| 50 | Oklahoma City, OK | $ 226,276 | $ 216,848 | $ 9,428 | 4.3% | -1.8% |
| 51 | Minneapolis-St Paul, MN | $ 348,153 | $ 333,815 | $ 14,338 | 4.3% | 4.5% |
| 52 | Nashville, TN | $ 366,868 | $ 358,980 | $ 7,888 | 2.2% | -2.7% |
| 53 | Columbus, OH | $ 252,044 | $ 248,637 | $ 3,407 | 1.4% | -3.4% |
| 54 | Dallas-Fort Worth, TX | $ 340,402 | $ 338,239 | $ 2,163 | 0.6% | -2.9% |
| 55 | Tulsa, OK | $ 214,825 | $ 214,466 | $ 359 | 0.2% | -5.0% |
| 56 | Stamford, CT | $ 528,387 | $ 530,502 | $ (2,115) | -0.4% | 2.9% |
| 57 | Worcester, MA | $ 344,372 | $ 347,343 | $ (2,971) | -0.9% | 0.2% |
| 58 | Louisville-Jefferson County, KY | $ 221,652 | $ 223,607 | $ (1,955) | -0.9% | 2.1% |
| 59 | Virginia Beach, VA | $ 280,657 | $ 284,764 | $ (4,107) | -1.4% | -2.3% |
| 60 | Bakersfield, CA | $ 288,485 | $ 293,294 | $ (4,809) | -1.6% | 0.6% |
| 61 | Milwaukee, WI | $ 223,920 | $ 228,751 | $ (4,831) | -2.1% | -3.3% |
| 62 | Phoenix, AZ | $ 375,924 | $ 386,890 | $ (10,966) | -2.8% | 0.2% |
| 63 | Las Vegas, NV | $ 337,896 | $ 350,890 | $ (12,994) | -3.7% | -4.2% |
| 64 | Greenville, SC | $ 237,708 | $ 246,999 | $ (9,291) | -3.8% | -3.5% |
| 65 | Ventura, CA | $ 723,557 | $ 752,004 | $ (28,447) | -3.8% | -3.5% |
| 66 | Raleigh, NC | $ 336,267 | $ 349,854 | $ (13,587) | -3.9% | -5.7% |
| 67 | Charleston, SC | $ 340,933 | $ 355,675 | $ (14,742) | -4.1% | -3.2% |
| 68 | Washington, DC | $ 457,858 | $ 481,322 | $ (23,464) | -4.9% | -3.7% |
| 69 | Tucson, AZ | $ 278,721 | $ 293,438 | $ (14,717) | -5.0% | -2.1% |
| 70 | Albuquerque, NM | $ 260,564 | $ 277,706 | $ (17,142) | -6.2% | -4.2% |
| 71 | Kansas City, MO | $ 246,116 | $ 269,957 | $ (23,841) | -8.8% | -6.2% |
| 72 | Sacramento, CA | $ 478,737 | $ 526,937 | $ (48,200) | -9.1% | -1.1% |
| 73 | Colorado Springs, CO | $ 382,606 | $ 424,084 | $ (41,478) | -9.8% | -2.0% |
| 74 | San Antonio, TX | $ 247,194 | $ 276,743 | $ (29,549) | -10.7% | -4.3% |
| 75 | Richmond, VA | $ 267,915 | $ 300,386 | $ (32,471) | -10.8% | -0.3% |
| 76 | Omaha, NE | $ 213,909 | $ 242,599 | $ (28,690) | -11.8% | -2.3% |
| 77 | Houston, TX | $ 260,084 | $ 296,370 | $ (36,286) | -12.2% | -6.4% |
| 78 | Little Rock, AR | $ 171,318 | $ 197,632 | $ (26,314) | -13.3% | -1.1% |
| 79 | Des Moines, IA | $ 212,864 | $ 246,746 | $ (33,882) | -13.7% | -0.1% |
| 80 | Madison, WI | $ 267,964 | $ 316,252 | $ (48,288) | -15.3% | 0.1% |
| 81 | McAllen, TX | $ 155,442 | $ 186,155 | $ (30,713) | -16.5% | N/A |
| 82 | Boise City, ID | $ 376,551 | $ 457,797 | $ (81,246) | -17.7% | 1.0% |
| 83 | Urban Honolulu, HI | $ 508,768 | $ 632,942 | $ (124,174) | -19.6% | -2.4% |
| 84 | Ogden, UT | $ 314,990 | $ 394,443 | $ (79,453) | -20.1% | -4.5% |
| 85 | Los Angeles-Long Beach-Anaheim, CA | $ 652,599 | $ 817,218 | $ (164,619) | -20.1% | 2.1% |
| 86 | San Diego, CA | $ 591,636 | $ 741,076 | $ (149,440) | -20.2% | 0.3% |
| 87 | Denver, CO | $ 408,991 | $ 524,848 | $ (115,857) | -22.1% | -1.6% |
| 88 | Portland, OR | $ 372,979 | $ 489,094 | $ (116,115) | -23.7% | 2.7% |
| 89 | Fort Collins, CO | $ 338,518 | $ 454,541 | $ (116,023) | -25.5% | -2.2% |
| 90 | Austin, TX | $ 339,035 | $ 462,254 | $ (123,219) | -26.7% | -2.8% |
| 91 | Salt Lake City, UT | $ 324,276 | $ 449,105 | $ (124,829) | -27.8% | -1.4% |
| 92 | San Francisco, CA | $ 746,593 | $ 1,036,557 | $ (289,964) | -28.0% | -1.3% |
| 93 | Provo, UT | $ 312,431 | $ 441,684 | $ (129,253) | -29.3% | -3.0% |
| 94 | Seattle, WA | $ 450,987 | $ 638,836 | $ (187,849) | -29.4% | -0.6% |
| 95 | Wichita, KS | $ 126,402 | $ 194,826 | $ (68,424) | -35.1% | -2.4% |
| 96 | San Jose, CA | $ 751,095 | $ 1,260,839 | $ (509,744) | -40.4% | 0.5% |