

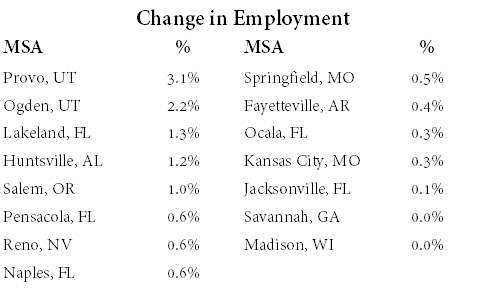
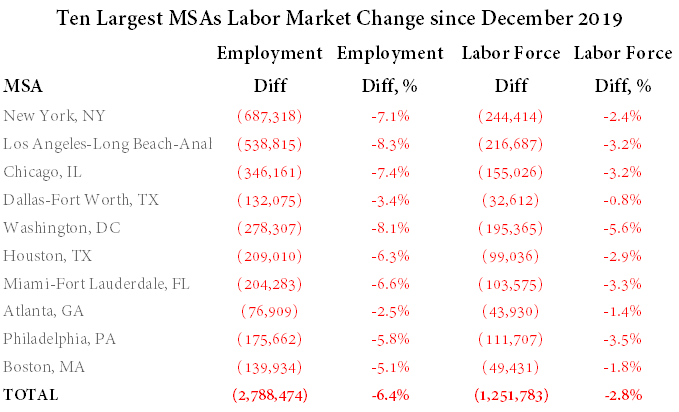
The US is amid a drastic recovery in unemployment from the pandemic high of 14.8% in April 2020 to 5.9% as of June 2021. While total employment has not recovered to the 2019 peak levels in most markets, 15 have actually seen improvements. Interestingly, Kansas City is the only metro of the 35 largest in the US to see any increase in employment. The ten largest markets face payroll gaps of 2.8 million (or 6.4%) versus the peak in December 2019.
Looking more closely at labor force levels, the “jobs problem” is more pronounced than what unemployment data suggest. Using the top ten MSAs as an example, employment levels are down 2.8 million and an additional 1.3 million have left the labor force entirely. While some of the decline is accounted for by “discouraged workers” who gave up trying to find a job, another reason is migration.
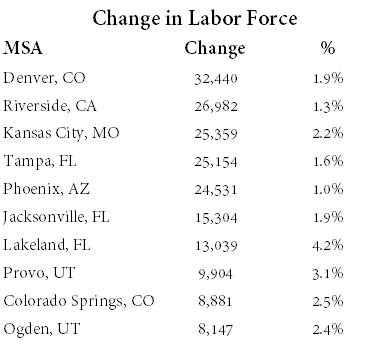
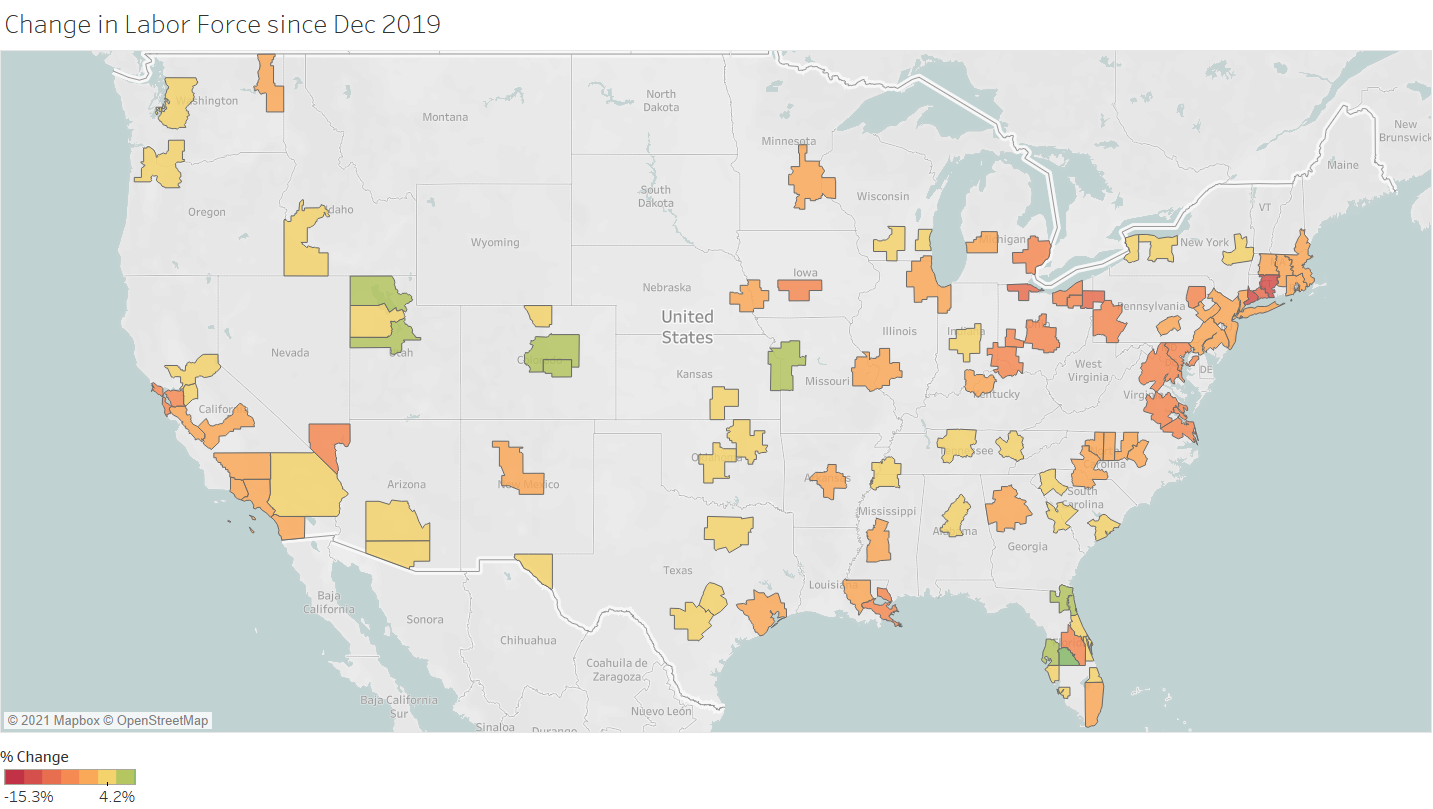
The state of California’s labor force is 500k lower, so where are people moving to? Utah, Colorado and Florida all saw significant labor force increases over the last 18 months. Denver, CO led all markets with a net increase of 32k workers, followed by Riverside, CA and Kansas City, MO.
More metro level macroeconomic market analysis will follow in a series of reports as a part of an ongoing valuation study for US residential real estate, so stay tuned.