

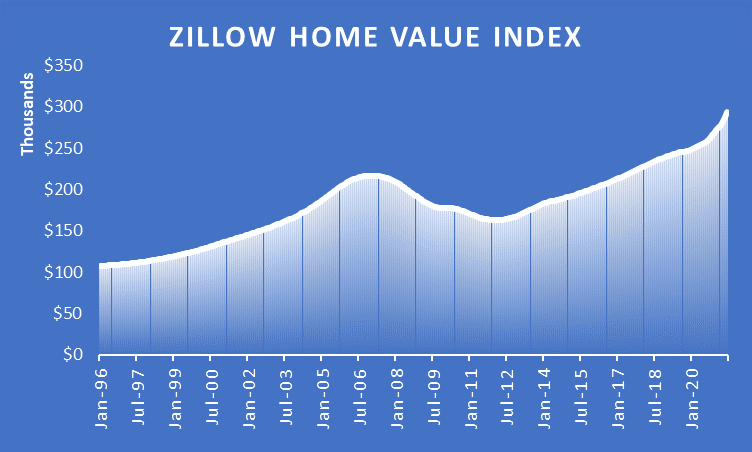
Home Values, as of June 2021
Nearly every US residential real estate market is experiencing price increases and tightening inventories. Homes are selling in quick order, often receiving offers before hitting MLS. Pension funds and speculators are joining the fray, crowding out buyers and creating bidding wars across the country. National prices as measured by the Zillow Home Value Index (ZHVI) increased 15% in last 12 months to a new record high.
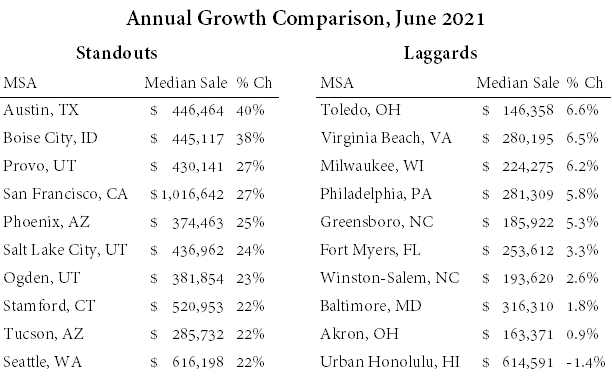
Some markets performed much better than others. Top performing markets saw at least 25% in median price appreciation over the last year (Austin, Boise City, Provo, San Francisco, and Phoenix). Urban Honolulu (decline), Akron, Baltimore, Winston-Salem, and Fort Myers were laggards with the slowest growth.
Is the housing market now overvalued? Let’s explore the 100 largest US Metropolitan Statistical Areas (MSAs) and dig deeper into the macroeconomic data to answer that question. We will see which recent price increases are fundamentally merited and which are not. To determine this, we created statistical models to estimate fair valuation for each metro using quantitative analytics on real estate and labor market data.
Using these models, we identify which markets from an objective standpoint are selling below fundamental value. In other words: Where (if anywhere!) are homes undervalued today?
The next section outlines some of the key fundamental comparisons across residential markets: Price-to-Rent Ratio, Inventories, Unemployment Rate, Population Growth, and Income. These metrics are extremely important as they account for most of the country-wide variation in median sales prices.
Our study supplements real estate statistics from Zillow with labor market statistics from BLS.
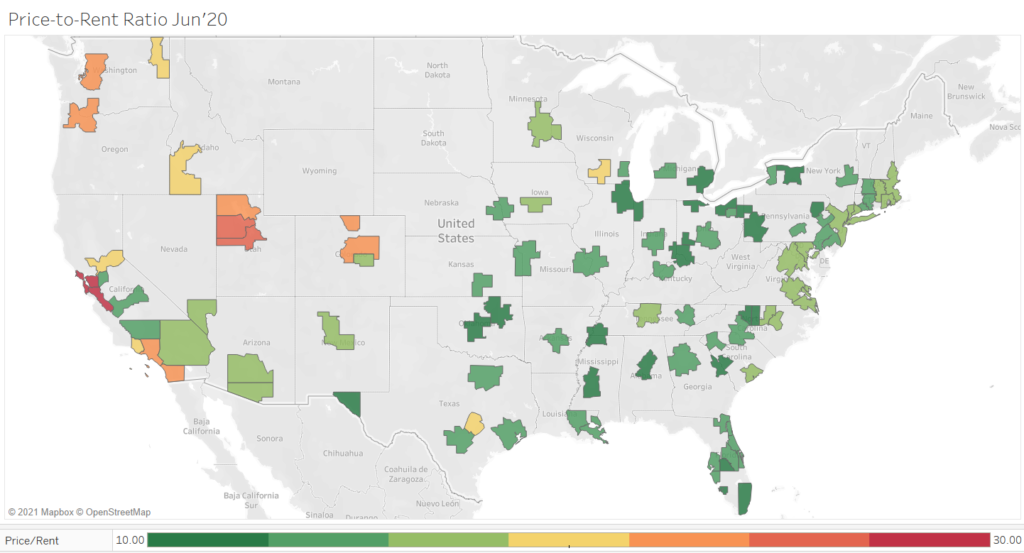
Price-to-Rent Ratio
The Price-to-Rent ratio is the most important driver to fundamental valuation for a market. It essentially provides an approximate estimate to the number of years in terms of market rent to cover the current median sale price of the home in a market. All else equal, it provides a fundamental backing to a potential market valuation – approximating how much rent and income would a property owner expect for a given investment.
Concerning for the MSAs that saw large increases in price, rents have not followed suit. This is evident by evaluating the widespread jump in Price-to-Rent ratios across the country. Visually, this looks similar to a worsening west coast drought map in comparison to June 2020:
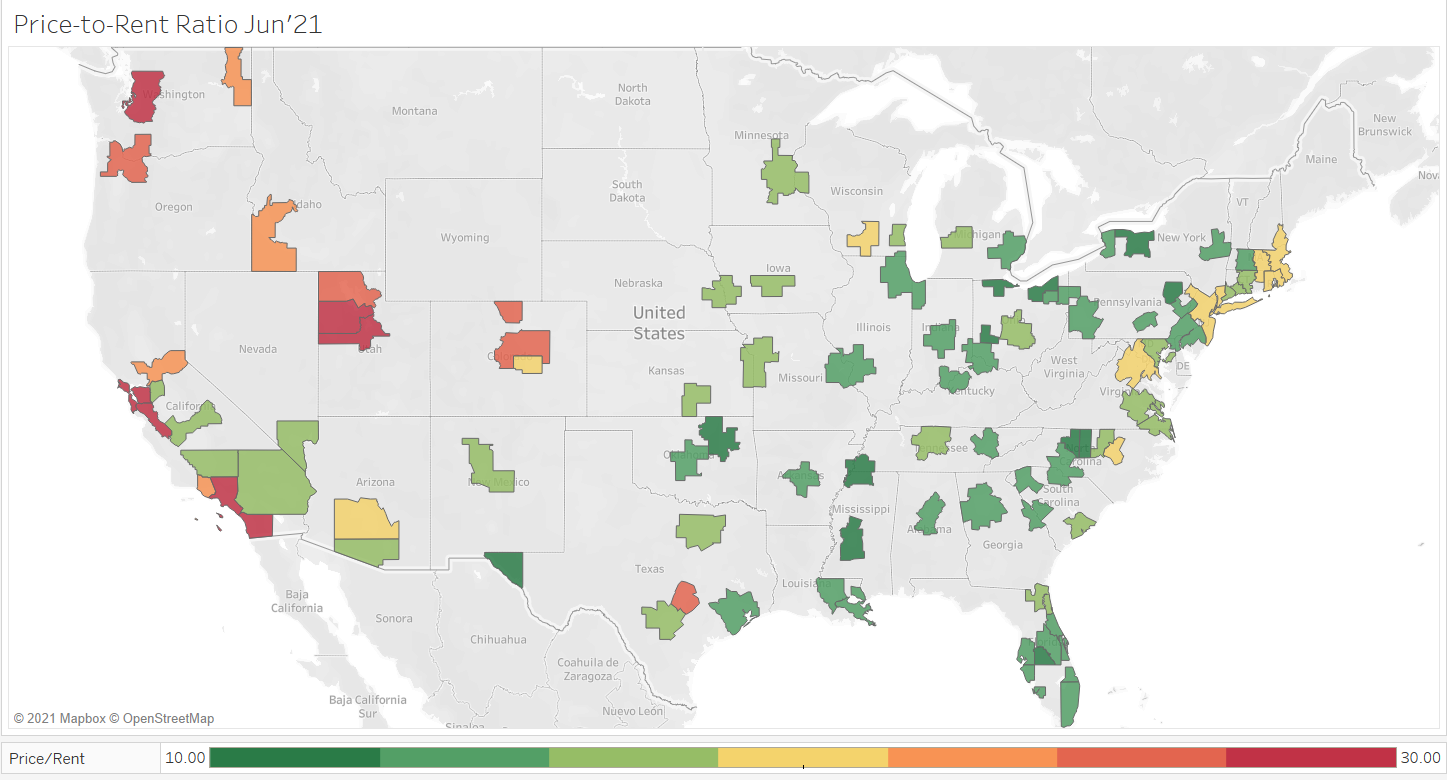
Some markets in the Midwest and southeast, especially Florida look fairly priced in the 10-15X range.
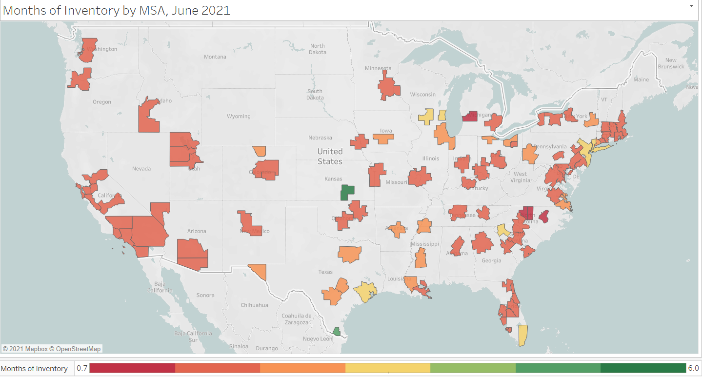
Inventories
Miami joined the other nine largest markets with inventories falling under four months of supply. Boston and Washington, DC metro areas currently have inventories below two months of supply.
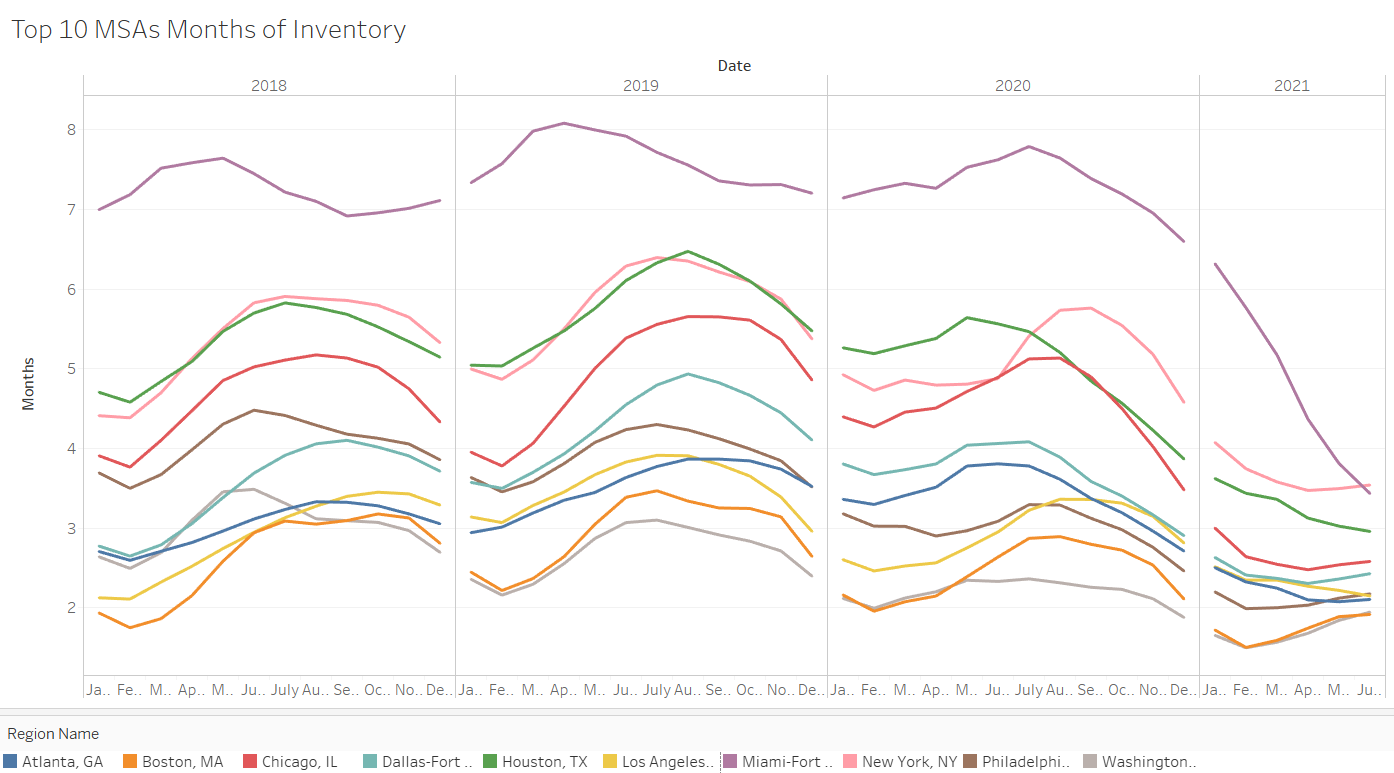
Among the largest 100 MSAs, some cities with inventories under one month. Tight supplies should be conducive to future price increases (as to ration demand). For that reason, markets on the red side of the color spectrum should see upward price support.
Four metros in North Carolina, Grand Rapids, and Colorado Springs have the tightest inventory levels in the country, under 1.4 months.
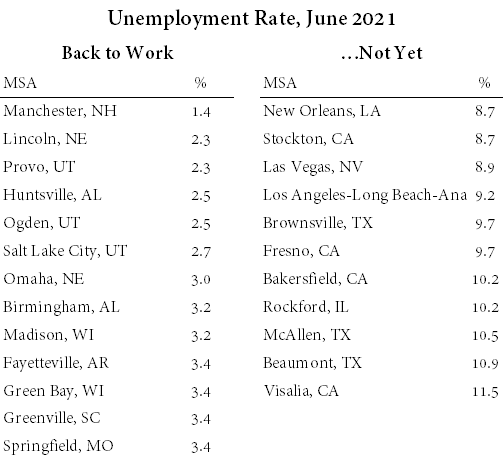
Unemployment Rate
National unemployment quadrupled in the spring of 2020 to nearly 15%, we have still yet to see this normalize to pre-pandemic levels in most markets. Without getting into the nuances of the Bureau of Labor Statistics’ metric flaws, increases in the Civilian Labor Force by market shows effects from both increases in population and the impact from discouraged workers coming back into the work force. This figure is still important to us because it will quantify changes in demand within specific markets.
The recovery has not been uniform as witnessed by the divergence in unemployment rates across the US. Economic openness likely played a major role. Bigger cities are still disproportionately affected. California has nine of the seventeen MSAs with the highest unemployment rates in the country.

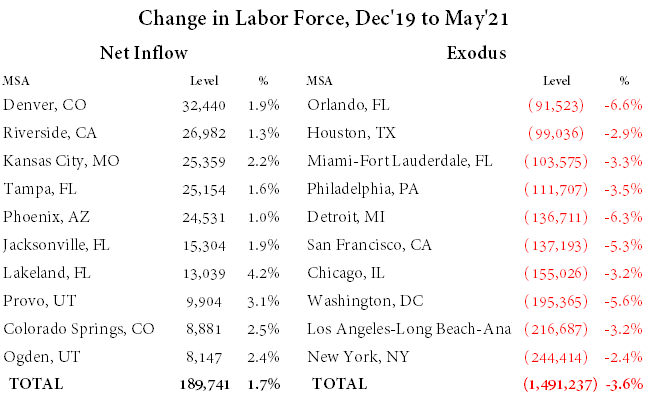
Population Growth & US Migration
To identify the impact of Covid on employment and populations, we evaluated the labor force changes since December 2019. Big cities face significant revenue shortfalls in comparison to pre-Covid times which should create a drag on real estate values. Seven of the ten largest MSAs made the list for the largest labor force decline. Net inflows of were led by Denver, Riverside, Kansas City, Tampa, and Phoenix.
Income
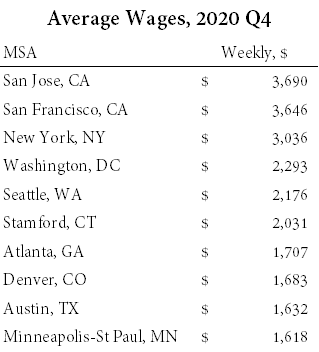
Lastly, aside from willingness to pay rent, we are taking for granted the ability to actually afford it. So we will need to account for median income levels. Fortunately, the BLS provides estimated wage by MSA, however the data are only updated through 2020 Q4.
The top ten MSAs by income are an unsurprising list of usual suspects:
Introducing Residential Real Estate Fundamental Value Rankings
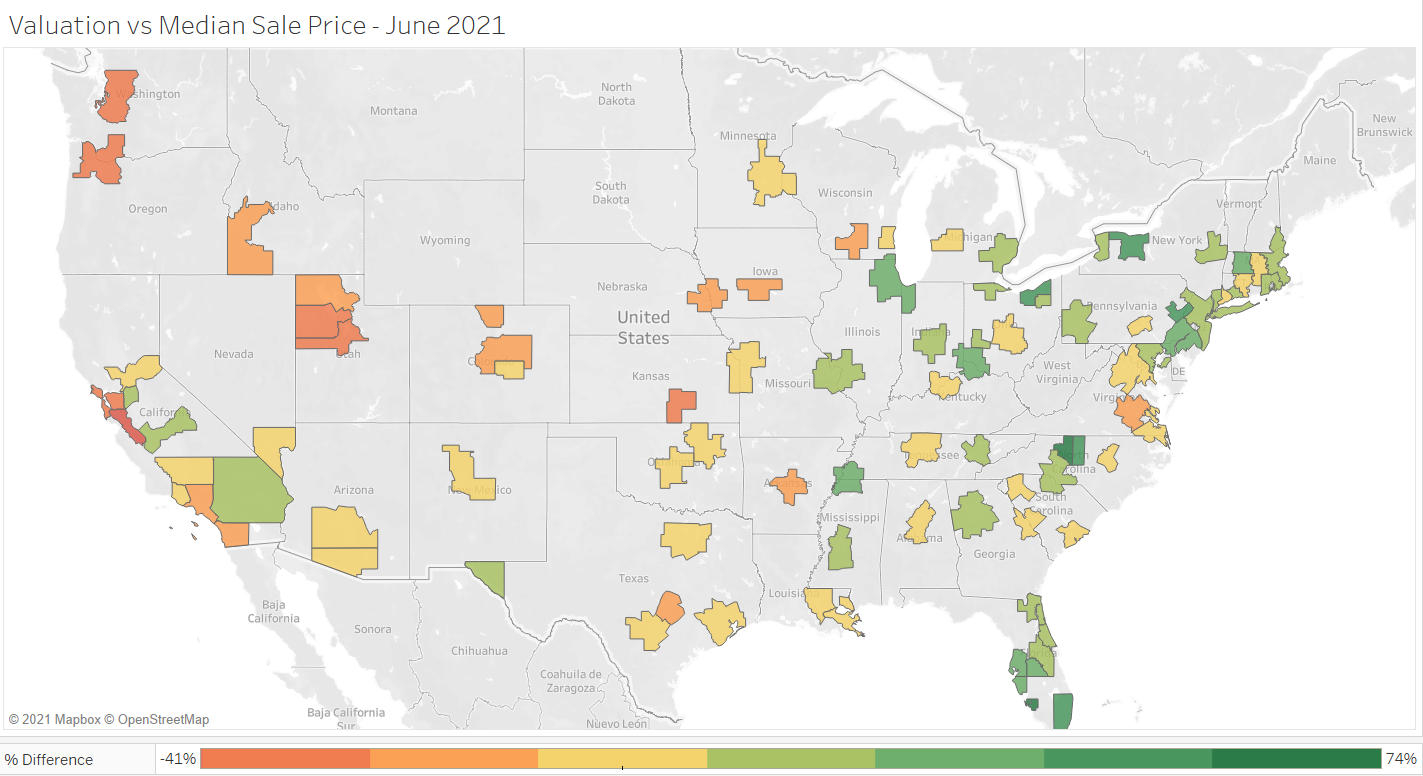
Weighing all of these factors, the Value Portfolio fitted quantitative statistical valuation estimates for each market. Markets are then ranked by most likely to be undervalued, given its fundamentals.
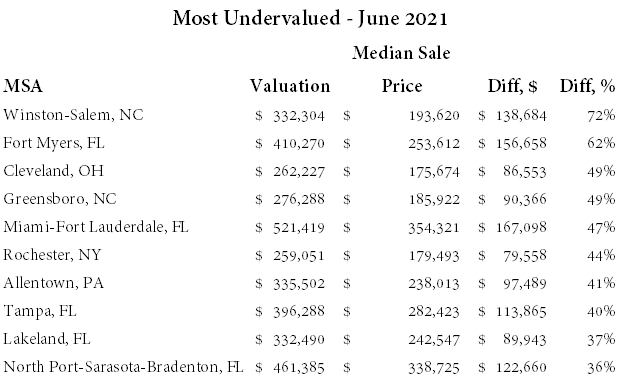
Below is the initial list for the most undervalued residential real estate markets. Florida and North Carolina account for 70% of the top ten markets. These can be primarily attributed to relatively attractive Price-to-Rent ratios (FL) and tight inventories (NC).
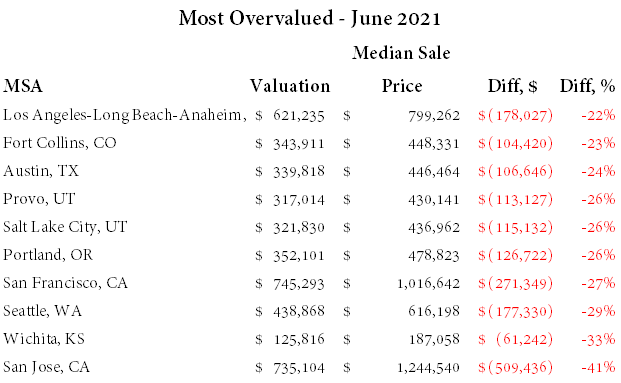
The most overvalued residential real estate markets are those listed below. Not surprisingly, Los Angeles is on the list. With a Price-to-Rent multiple over 27x, 9.2% unemployment rate, and 3.2% labor force decline since pre-pandemic, it is easy to see why.
Five other MSAs on the overvalued list saw the largest value increases in the last twelve months (Austin, Provo, Salt Lake City, San Francisco, and Seattle). Key fundamentals for these market will need to improve to substantiate the current frothy price levels.
Is Your Market Undervalued?
For the full list of cities, check thevalueportfolio.com for valuation, rankings and more analysis. We will continue to monitor market updates through regular monthly reporting.